Spectral indices#
After having pre-processed the image, proceeded with spectral reduction and identified end-members, we can finally quantify spectra using indices via the SpectralIndexWidget:
Main#
In the main tab we select once again our export data folder. Clicking on load project will load both the image and the end-member spectra.

Again, one needs to select the location of the data. Images are loaded in zarr format so they can be browsed through.
Indices#
In this tab, one can define and compute various indices to quantify absorption bands. In the Index Definition section, a series of common indices have been preset to use certain combinations of wavelengths. Those can be adjusted either by entering values or by dragging the sliders below the plot. Once adjustments have been made, one can keep those for the the selected index name by clicking on Update current index. One can also create completely new indices by first selecting a triplet (RABD) or pari (RABA/Ratio/RMean) of wavelengths, defining a name (Myindex) and clicking on New index. New indices get added to the choices in the Index Definition. Here we create two new RABD indices around 450 and 600.

Once boundaries for index calculation are set, one can compute the index for the entire image in the next tab Index Compute.
Index Compute#
Indices defined in the previous tab appear now in the Index Selection. Indices to be computed can be selected with the tick boxes. The definitions of selected indices can be exported (as text files) and imported vie the Export index settings and Import index settings buttons.
Index computation can be executed from the Compute and export section by either:
clicking on
(Re-)Compute index map(s). This will overwrite existing index maps and add them to the viewer.clicking on
Add index map(s) to Viewer. This will add already computed maps to the Viewer and compute them is missing.
The colormap of each index can be adjusted in the main interface.
Note that is the Force recompute checkbox is ticked, index maps are recomputed every time they are needed. This ensures that e.g. when adjusting index boundaries, those changes are always taken into account.
/Users/gw18g940/mambaforge/envs/sediment_dev_oct24/lib/python3.12/site-packages/zarr/creation.py:614: UserWarning: ignoring keyword argument 'read_only'
  compressor, fill_value = _kwargs_compat(compressor, fill_value, kwargs)
/Users/gw18g940/mambaforge/envs/sediment_dev_oct24/lib/python3.12/site-packages/zarr/creation.py:614: UserWarning: ignoring keyword argument 'read_only'
  compressor, fill_value = _kwargs_compat(compressor, fill_value, kwargs)

Projection ROI#
In addition to index maps, a line-by-line projection within a certain ROI can also be computed, resulting in a 1D signal summarising the index map. The ROI can be adjusted by changing its width in Projection roi widht and double-clicking in the desired location on the image. The roi can also be adjusted manually directly in the layer. The resulting signal can be smoothed using options visible in the Projection section, Smooth window size indicating the window size used for Savgol filtering.
Saving figures#
The index maps can be saved as tiff files. Alternatively they can be exported in two types of figures:
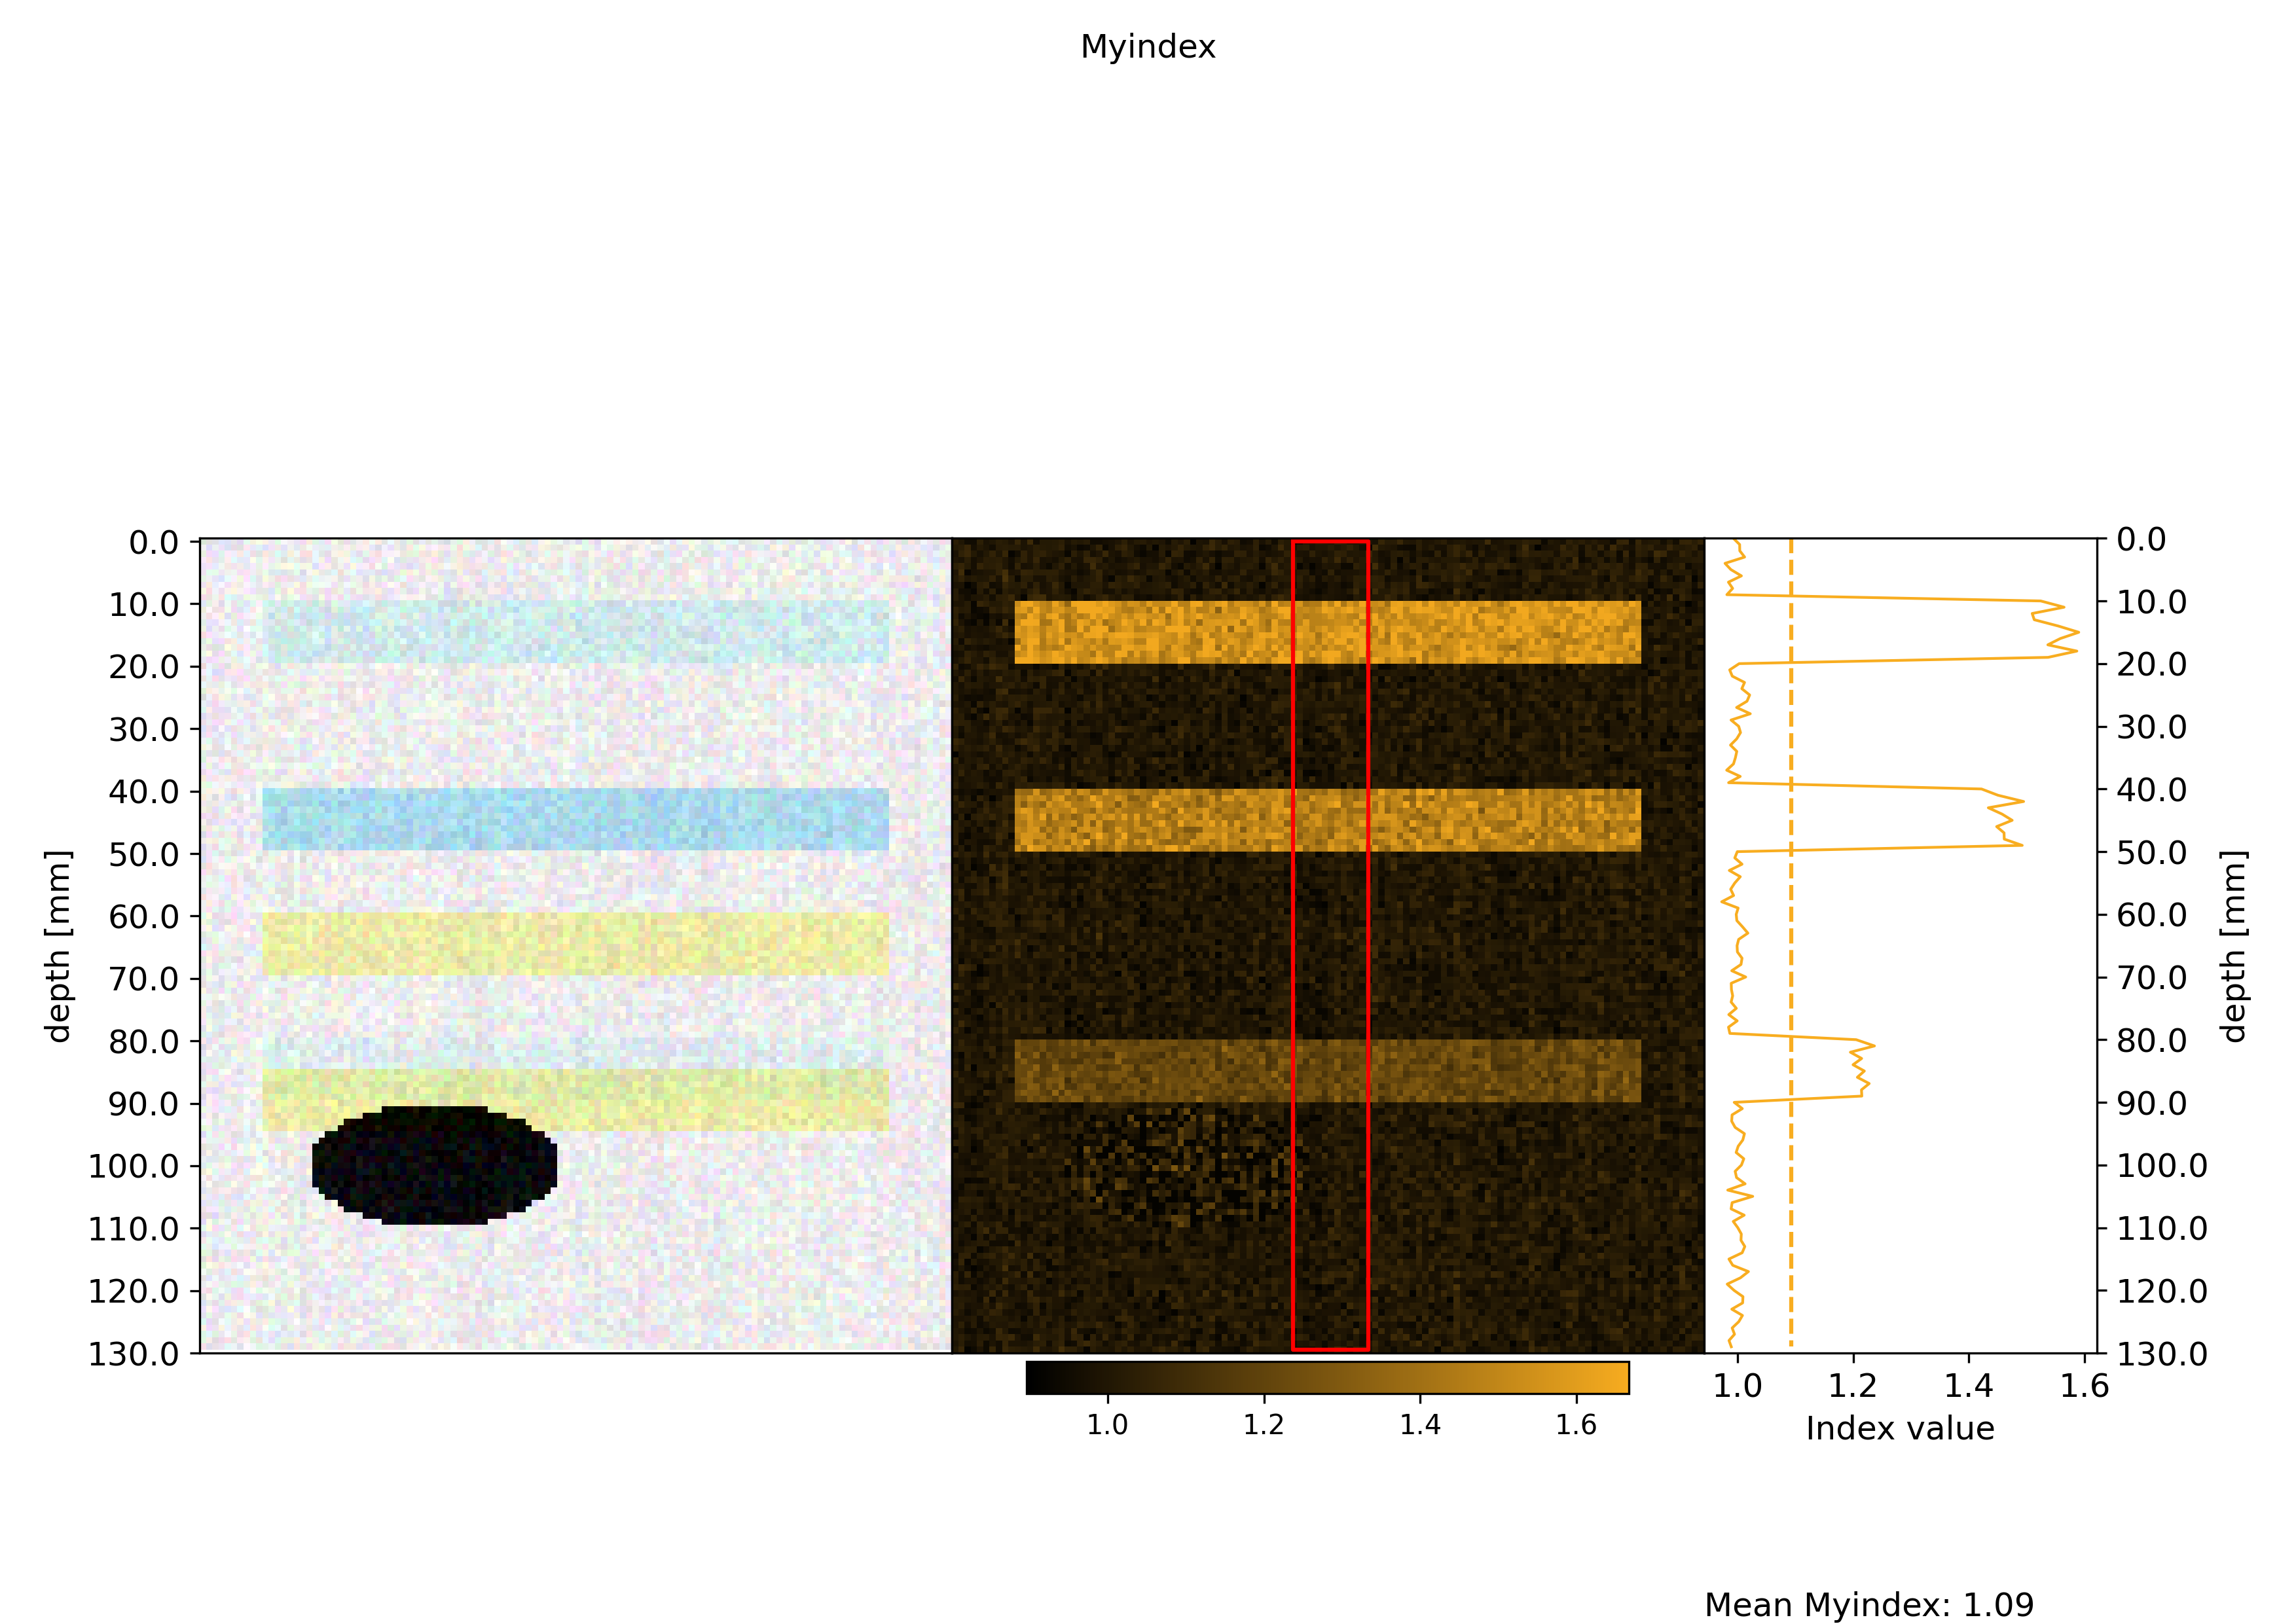
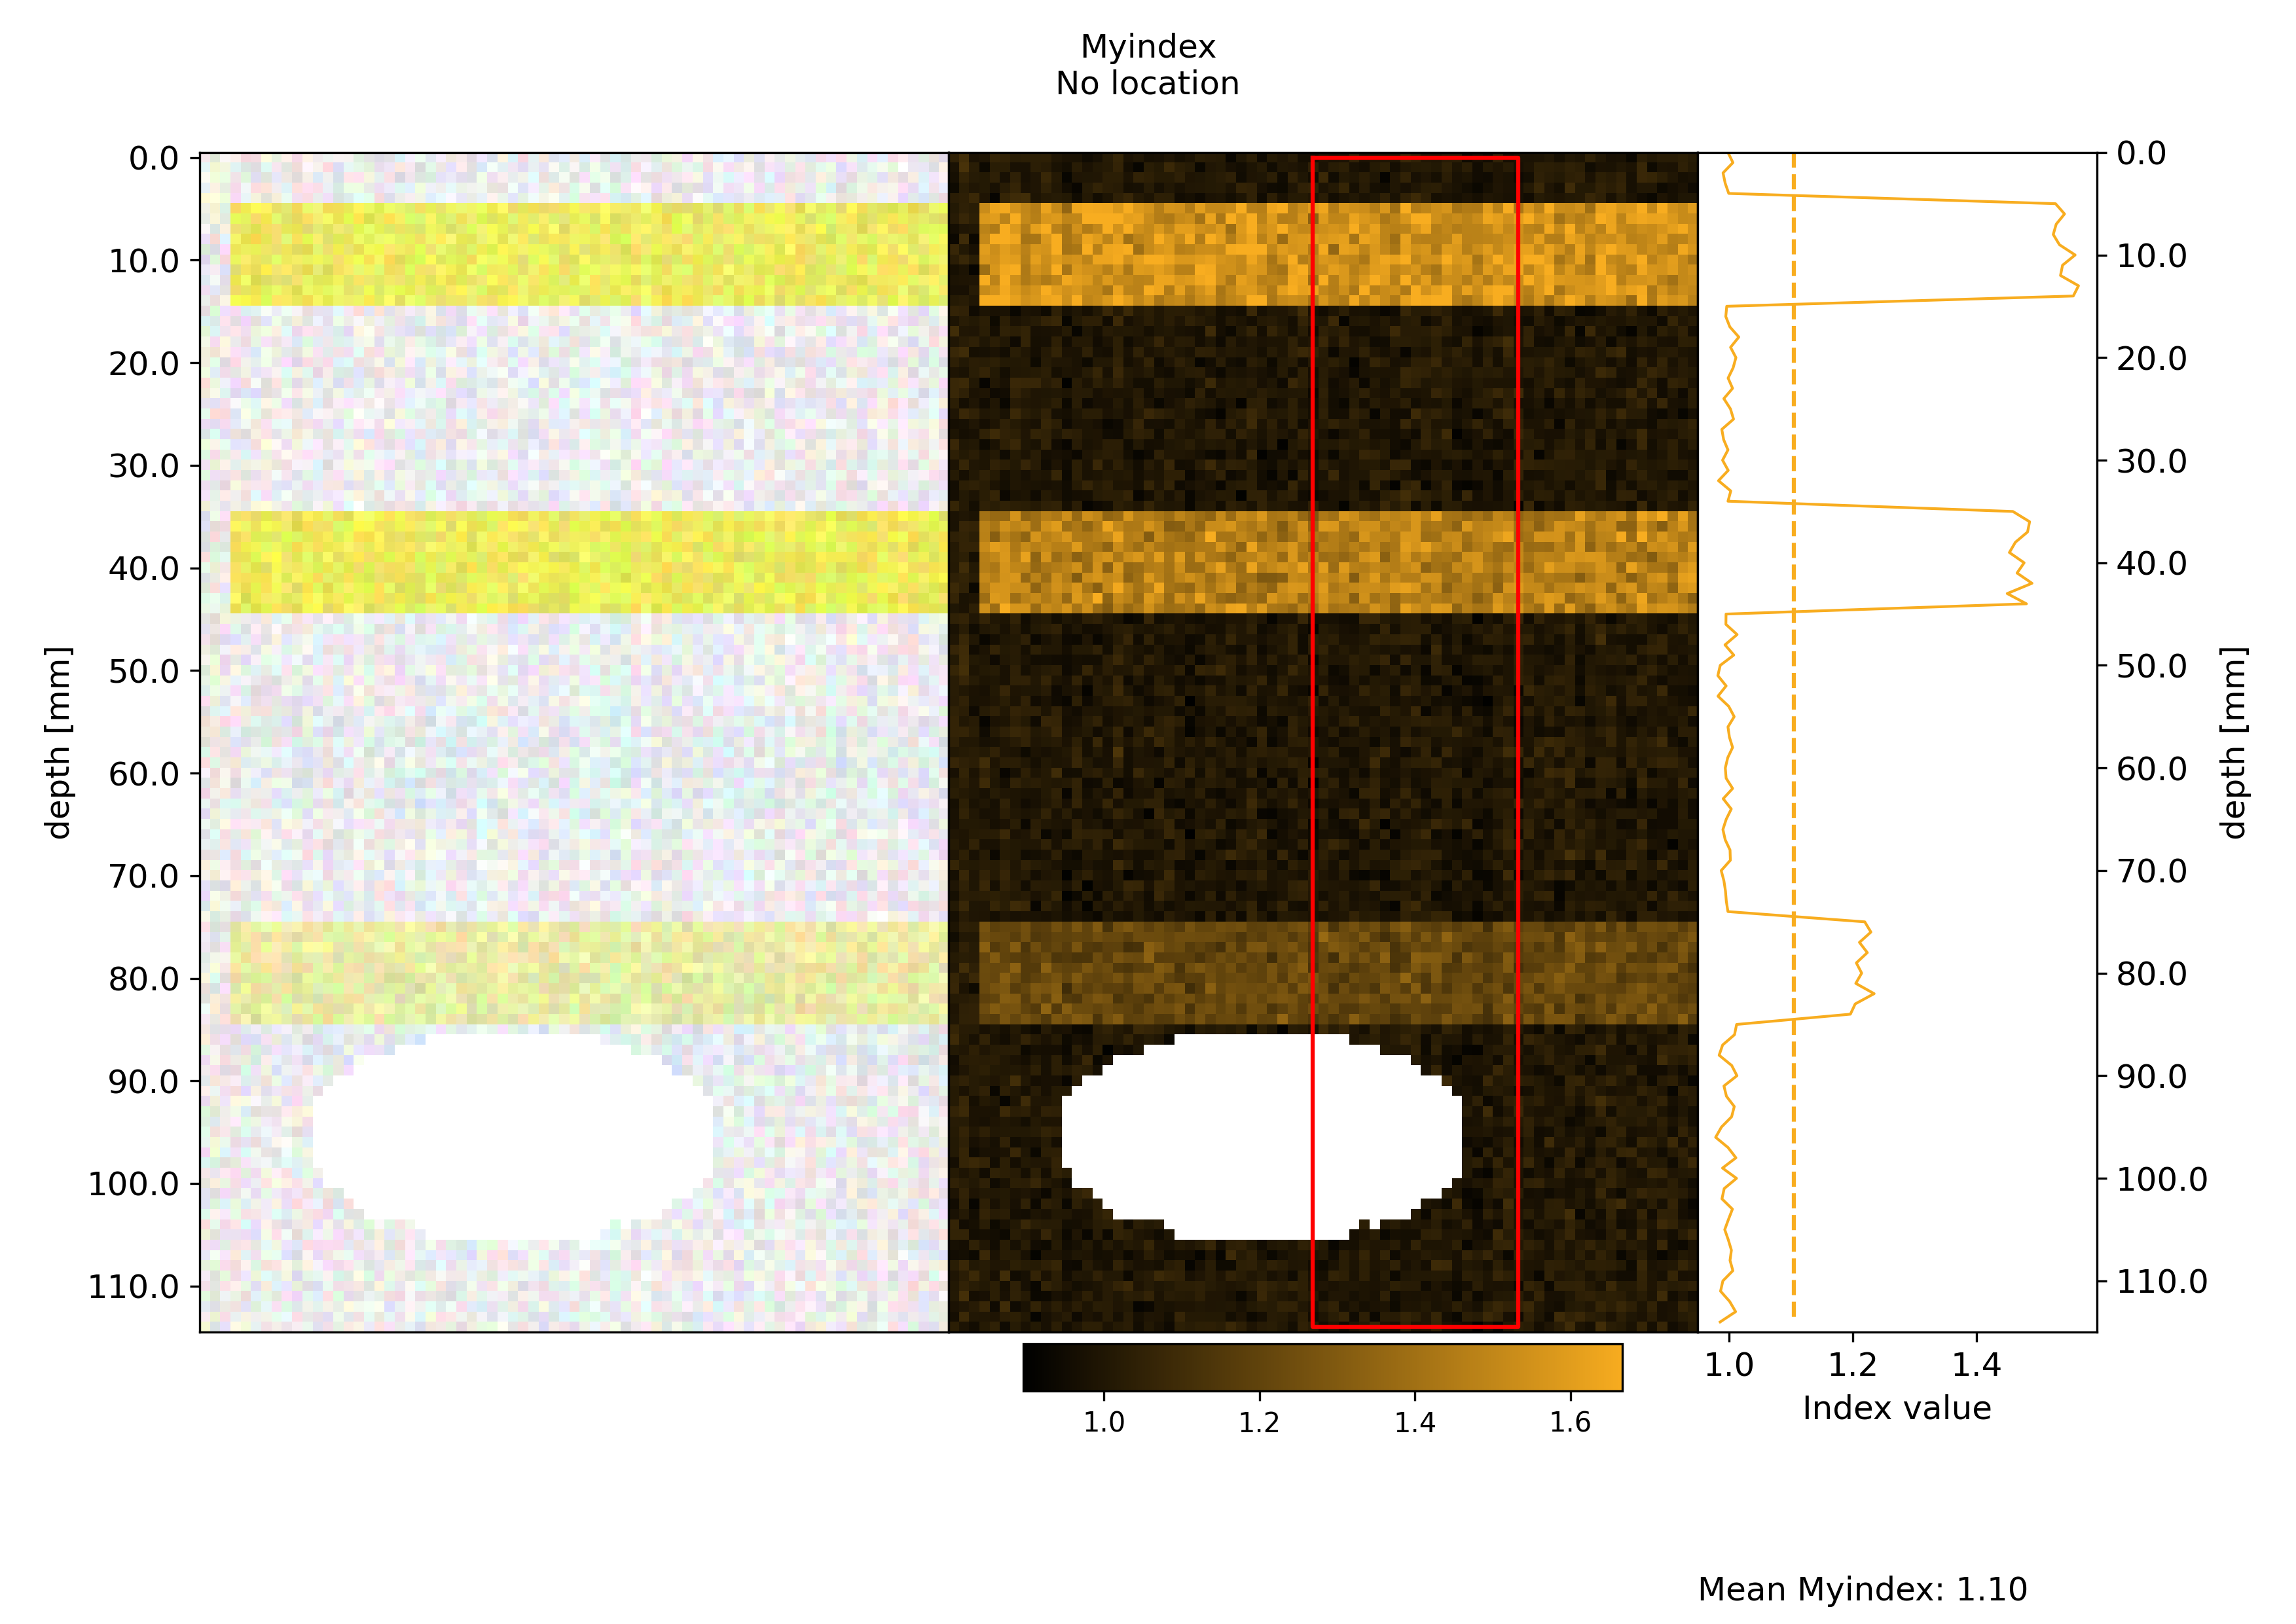
figures containing an image of the data, the index map as well as the projection
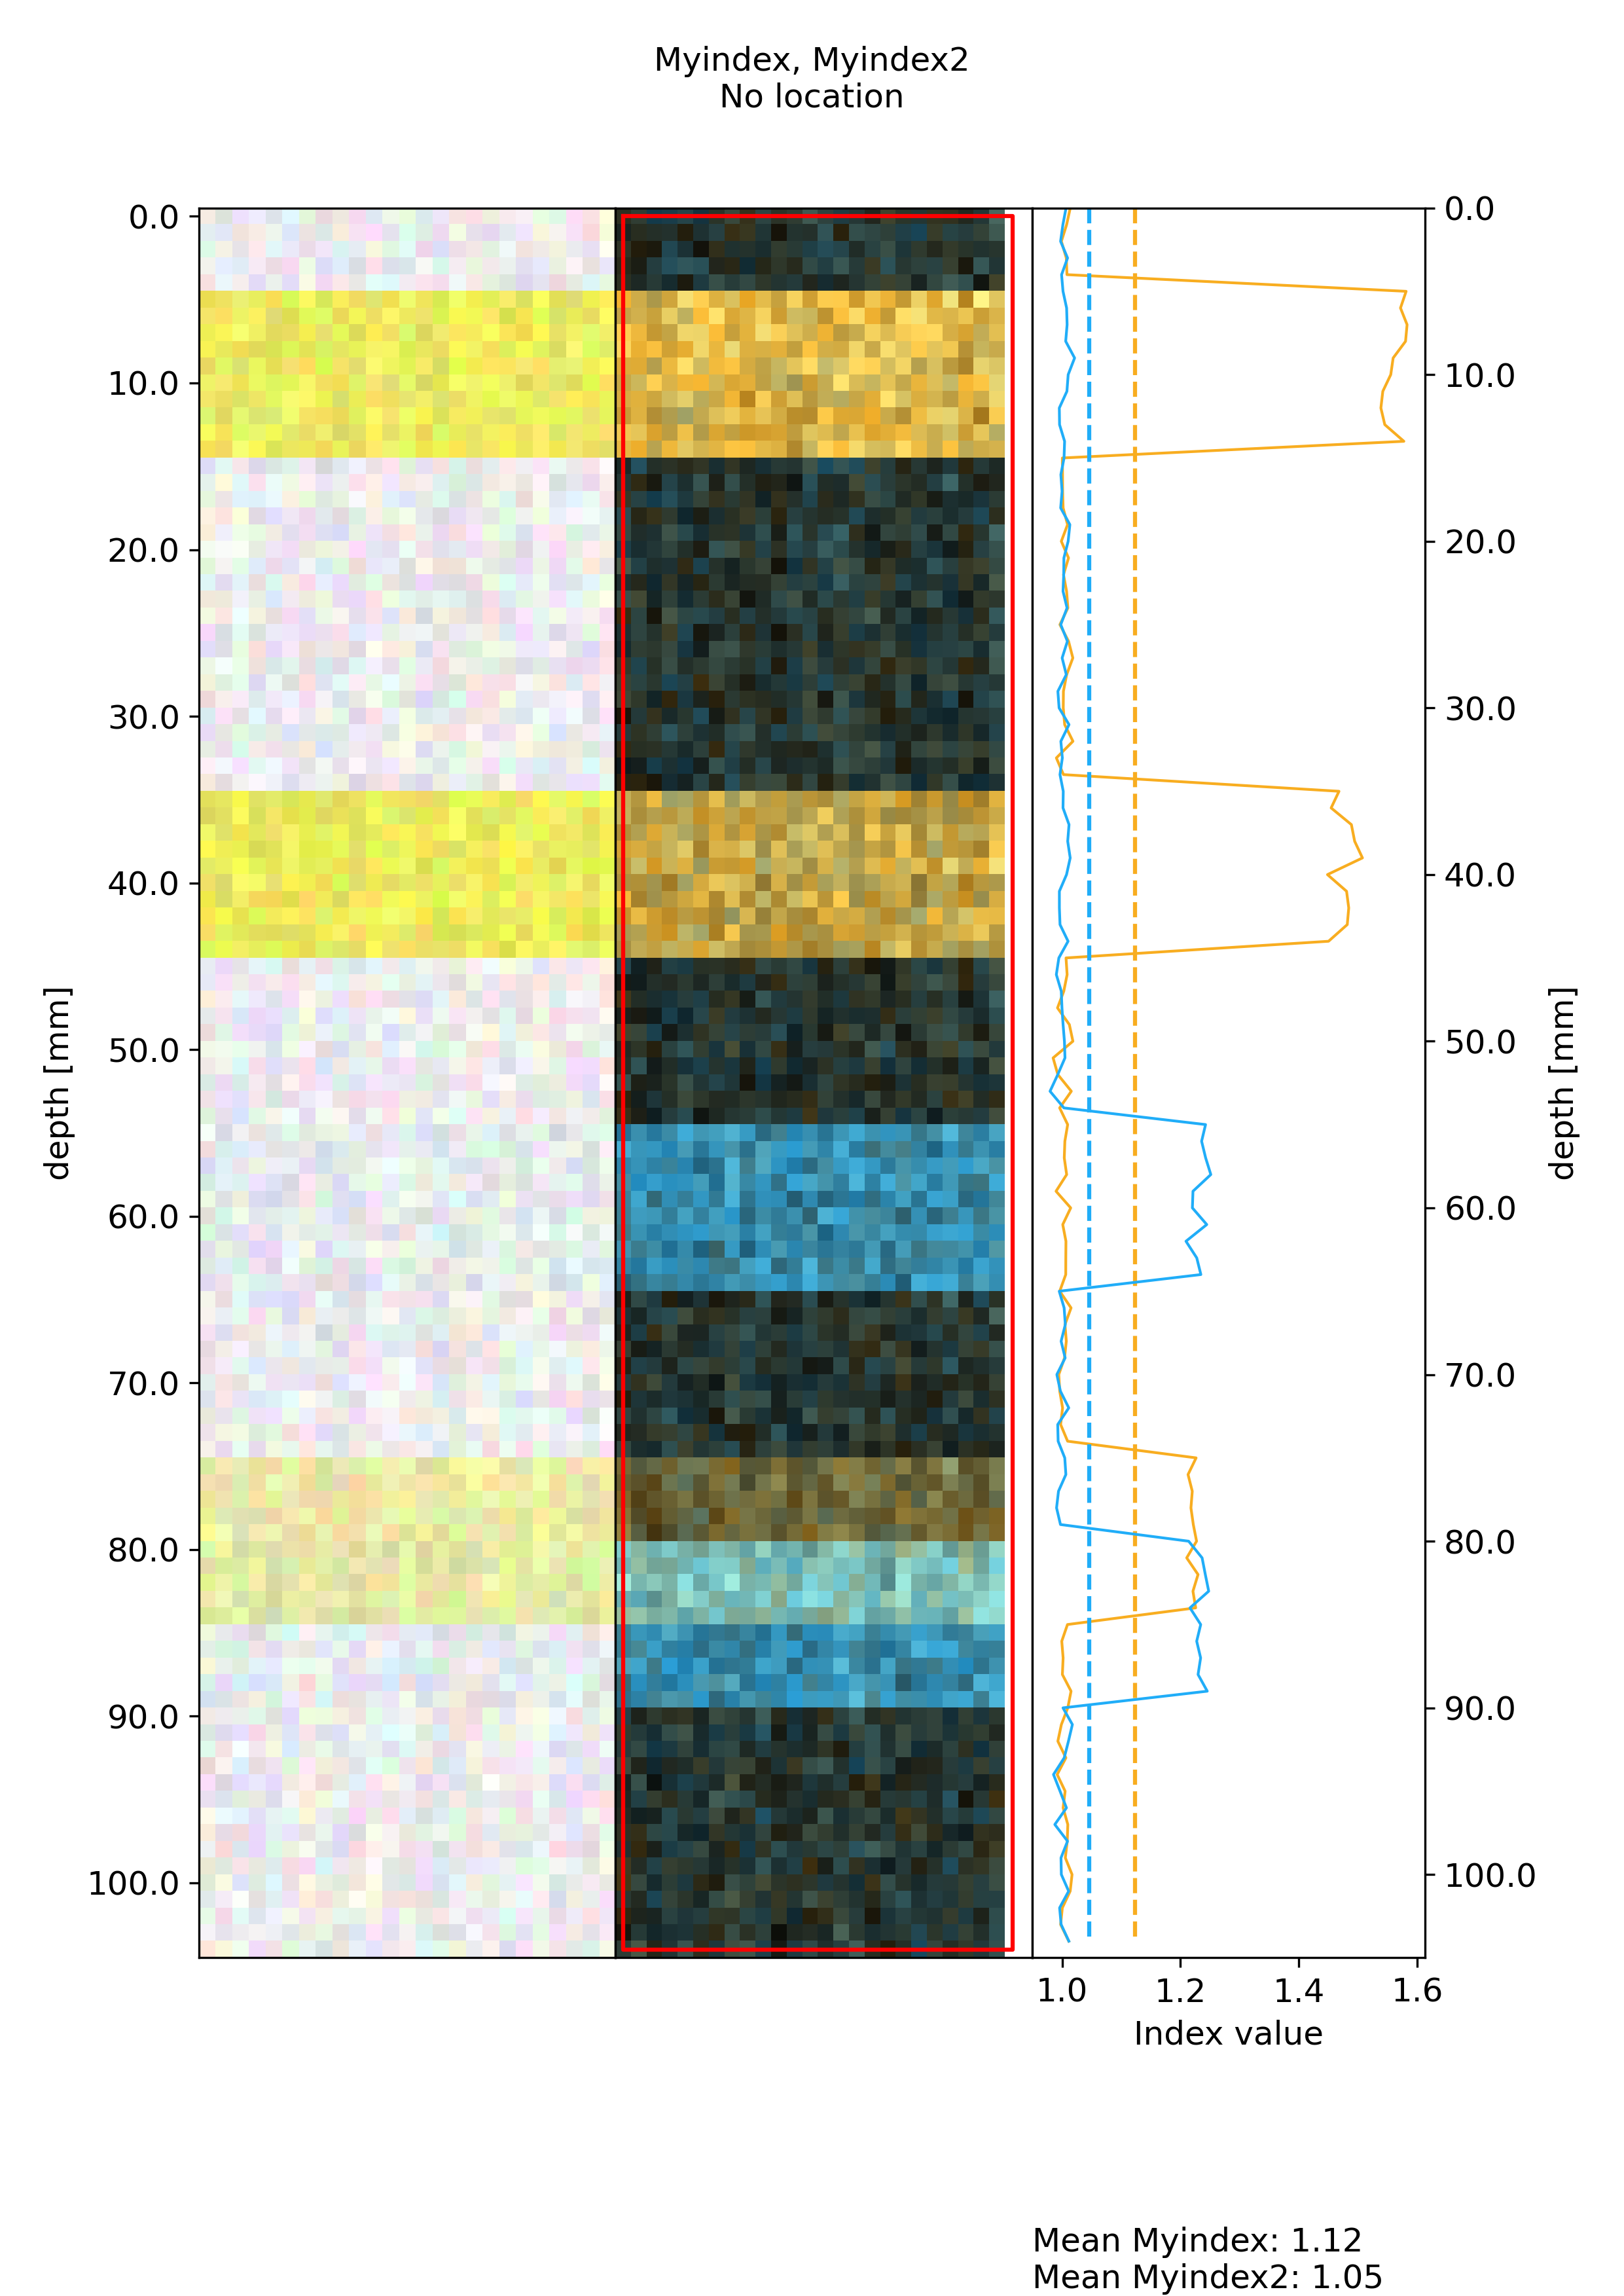
figures containing an image of the data, an overlay of two index maps as well as the projections of both indices
a figure combining all index maps
These figures can all be automatically generated using the Create and Save all index plots button. Additionally one can:
generate all plots for all ROIs (with the same settings) by ticking the box
Process all ROIscreate a normalized version of the figures where intensity ranges are the same across multiple ROIs. An example of such figures is visible below:
Plots#
If desired, some of the rendering options of figures can be adjusted in this tab. Those include:
Title Font: the font size used for the plot title including the index nameLabel Font: the font size for plots x, y labelsSelect plot line color: adjust the color of the projection linePlot line thickness: adjust the thickness of the projection lineThe location and scale can be changed here as well
Those plot parameters can be saved in a yml file by clicking on Save plot parameters and re-used later for other sessions. Results can be pre-viewed using the Create index plot and Create multi-index plot.

Batch#
In the batch tab you can run the whole index computing and figure generation for multiple experiments in a given folder. For that you will need:
a
Plot_parameters.ymlfile that you can save in the previous tab. This will be used to format all figures.an
index_settings.ymlfile that you get when generating figures or using theExport index settingsbutton in theIndex Computetab.
You can optionally also generate a normalized version of plots by ticking the Normalize box. This will normalize plots across all datasets in the main folder.
Here we use the settings used in our single dataset to analyze the sediment_export_series folder.

Here’s an example of the resulting figures. Note that like here, in case the no regions of interest have been selected in this series of data, plots are generated with the full images.